Refer to the graph below. Suppose that its shows the S and D graphs in a market where production entails a significant amount of pollution. In this case, the government should use its coercive power to make:
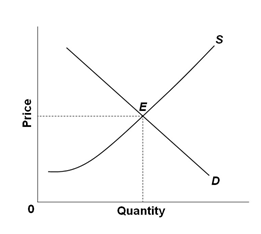
A. The supply curve shift to the left
B. The supply curve shift to the right
C. The demand curve shift to the left
D. The demand curve shift to the right
A. The supply curve shift to the left
You might also like to view...
The figure above shows the market for milk in Cowland. If a subsidy paid to producers of $1 per gallon of milk is introduced, what is the price that consumers pay?
A) $3.00 a gallon B) between $3.00 and $4.00 per gallon C) $4.00 a gallon D) between $4.00 and $5.00 per gallon
Elite colleges and universities use standardized test scores (such as SAT and ACT scores) and high school grades as
A) a means to raise student utility. B) a means to turn a university education from a "good" to a "bad." C) rationing devices. D) none of the above
The business cycle dating committee determines when peaks and troughs occur by looking at
A. mainly at real GDP figures. B. mainly at the unemployment rate. C. data from our economy and comparing it to data from other major nations. D. mainly at employment, industrial production, personal income, and manufacturing and trade revenue.
One In the News article titled "Consumer Confidence Index at Record Low" indicates that consumer confidence decreased. As a result, which of the following is most likely to happen?
A. Total spending will increase. B. Investment will increase. C. Autonomous consumption will decrease. D. Government spending will decrease.