Use the data to make a frequency distribution table.On a math test, 24 students got the following scores.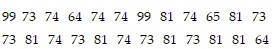 Frequency Distribution Table
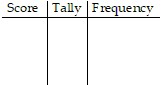
What will be an ideal response?
Frequency Distribution Table

Mathematics
You might also like to view...
Evaluate the determinant by expansion by minors.
A. -155 B. -120 C. 120 D. 85
Mathematics
Graph the function by starting with the graph of the basic function and then using the techniques of shifting, compressing, stretching, and/or reflecting.f(x) = x2 + 1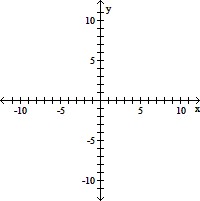
A. 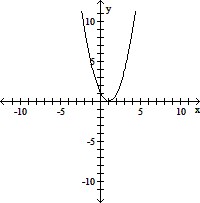
B. 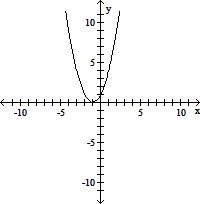
C. 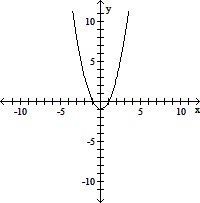
D. 
Mathematics
Simplify the complex fraction.
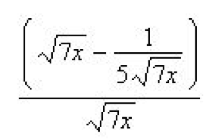
a. 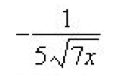
b. 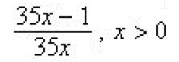
c. 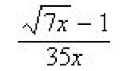
d. 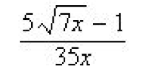
e. 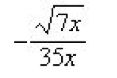
Mathematics
Graph the linear equation by finding and plotting its intercepts.-x + 2y = -2
A. 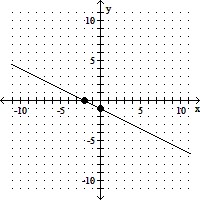
B. 
C. 
D. 
Mathematics