Solve for x. Be sure to reduce your answer. Check your solution.-  x = -
x = - 
A. x = 2
B. x = 11
C. x = 10
D. x = -4
Answer: A
You might also like to view...
The graph below shows the approximate annual percentage growth rate in world population for the years 1960 through 2010. Data is estimated by the UN Census Bureau.Annual Growth Rate (Percentage) 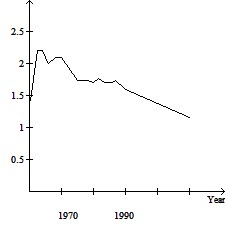 Use the graph to answer the question.In which year(s), if any, during the period 1960-2010 is world population constant?
A. 1969-1971 B. 1962-1964, 1969-1971, 1975-1980 C. 1962-1964 D. None
Construct a boxplot as requested.The highest temperatures ever recorded (in °F) in 32 different U.S. states are shown below. Construct a boxplot for the data set.
A. 
B. 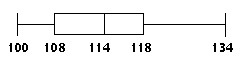
C. 
D. 
Find the derivative.y =  +
+ 
A. y ' = 2 cos x - csc2 x B. y ' = 2 csc x cot x - sec2 x C. y ' = 2 csc x cot x - csc2 x D. y ' = - 2 csc x cot x + sec2 x
Determine whether or not the function is one-to-one.f(x) = 5x2 + x
A. Yes B. No