Solve the problem.From April through December 2015, the stock price of QRS Company had a roller coaster ride. The chart below indicates the price of the stock at the beginning of each month during that period. Find the monthly average rate of change in price between June and September.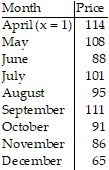
A. $11.50 per month
B. -$11.50 per month
C. -$7.67 per month
D. $7.67 per month
Answer: D
You might also like to view...
Simplify the expression. Assume that all variables are positive when they appear.
A. 
B. 
C. 
D. 
Multiply.(x - 3)(9x2 + x + 9)
A. 9x3 - 28x2 + 6x - 27 B. 9x3 - 26x2 + 6x - 27 C. 9x3 - 26x2 + 12x - 27 D. 9x3 + 26x2 + 6x - 27
Analyze the graph of the given function f as follows:(a) Determine the end behavior: find the power function that the graph of f resembles for large values of |x|.(b) Graph f using a graphing utility.(c) Find the x- and y-intercepts of the graph.(d) Use the graph to determine the local maxima and local minima, if any exist. Round turning points to two decimal places.(e) Use the information obtained in (a) - (d) to draw a complete graph of f by hand. Label all intercepts and turning points.(f) Find the domain of f. Use the graph to find the range of f.(g) Use the graph to determine where f is increasing and where f is decreasing.f(x) = -3x4 + ?x3 -  x + 4
x + 4
What will be an ideal response?
Find the area of the figure using determinants.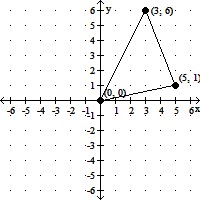
A. 10.5 B. 13.5 C. 9.5 D. 10.0