The graph of a function f is given. Use the graph to answer the question.What is the y-intercept?
A. (0, 10)
B. (0, -6)
C. (0, -8)
D. (0, 7)
Answer: B
Mathematics
You might also like to view...
Sketch the graph of the function f and evaluate 


Mathematics
Calculate, if possible.(-2.3) + (-6.1) + (-5.6) + 10
A. -11.8 B. 7.2 C. -4 D. 8.2
Mathematics
Divide. Leave your answer in exponent form. Assume that all variables in any denominator are nonzero.
A. 
B. 
C. 
D. 
Mathematics
Use a graphing calculator to plot the data and find the quadratic function of best fit.An engineer collects data showing the speed s of a given car model and its average miles per gallon M. Use a graphing calculator to plot the scatter diagram. What is the quadratic function of best fit?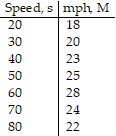
A. M(s) = 0.063x2 + 0.720x + 5.142 B. M(s) = -0.0063x2 + 0.720x + 5.142 C. M(s) = -6.309x2 + 0.720x + 5.142 D. M(s) = -0.631x2 + 0.720x + 5.142
Mathematics