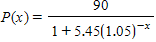
The graph shows the actual percentage of U.S. households with a computer as a function of household income (the data points) and a logistic model of these data (the curve). The logistic model is
?
?
?
where x is the household income in thousands of dollars. According to the model, what percentage of extremely wealthy households had computers?
?

?
P = __________%
Fill in the blank(s) with the appropriate word(s).
90
You might also like to view...
Evaluate the integral.
A. -  e-x4 + C
B. -  e-x5 + C
C. e-x4 + C
D. -4e-x5 + C
Find the indicated sum. Find the sum of the first 8 terms in the geometric series 3 - 6 + 12 - . . .
A. 765 B. -765 C. -255 D. -257
Complete the square and write the equation in standard form. Then give the center and radius of the circle.x2 + y2 - 12x - 6y + 33 = 0
A. (x + 6)2 +(y + 3)2 = 12
(-6, -3), r = 2
B. (x - 6)2 +(y - 3)2 = 12
(-6, -3), r = 2
C. (x - 6)2 +(y - 3)2 = 12
(6, 3), r = 2
D. (x - 6)2 +(y - 3)2 = 12
(6, 3), r = 12
Use Bayes' rule to find the indicated probability.Two stores sell a certain MP3 players. Store A has 34% of the sales, 5% of which are of defective items, and store B has 66% of the sales, 1% of which are of defective items. The difference in defective rates is due to different levels of pre-sale checking of the product. A person receives a defective item of this product as a gift. What is the probability it came from store B?
A. 0.275 B. 0.22 C. 0.5667 D. 0.7083