Use the following graph to answer the next question: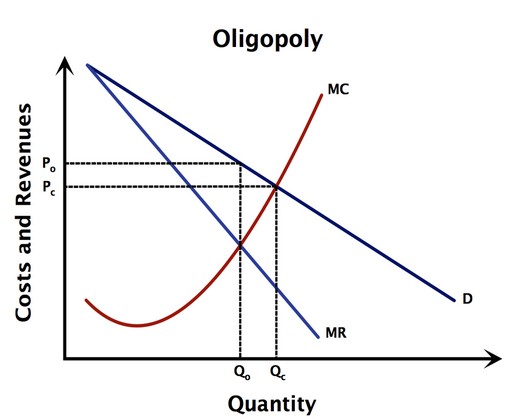 If the firm was operating as a perfectly competitive firm, what level of output would they produce to maximize profits?
A. Somewhere greater than Qc
B. Qc
C. Qo
D. Somewhere between Qc and Qo
Answer: B
You might also like to view...
When the Fed sells government bonds,
a. the money supply increases and the federal funds rate increases. b. the money supply increases and the federal funds rate decreases. c. the money supply decreases and the federal funds rate increases. d. the money supply decreases and the federal funds rate decreases.
Based on the graph showing U.S. health care expenditures as a percentage of GDP, the percentage has ______ from 2000 to 2017.
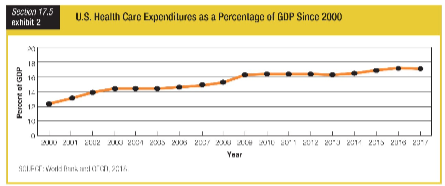
a. risen about 3 percent
b. risen about 10 percent
c. been cut in half
d. remained unchanged
If the domestic quantity supplied of a good is greater than the domestic quantity demanded, the country is likely to be a(n)
A. exporter of the good. B. importer of the good. C. consumer of the good. D. importer and exporter.
Which of the following is NOT true when there are large economies of scale such that one firm can produce at a lower average cost than can be achieved by multiple firms?
A) This situation produces a natural monopoly. B) Proportional increases in output yield proportionally small increases in total cost. C) The long-run average cost curve of the firm will increase at a low level of output. D) There will only be one firm in this industry.