Refer to the information provided in Figure 1.6 below to answer the question(s) that follow.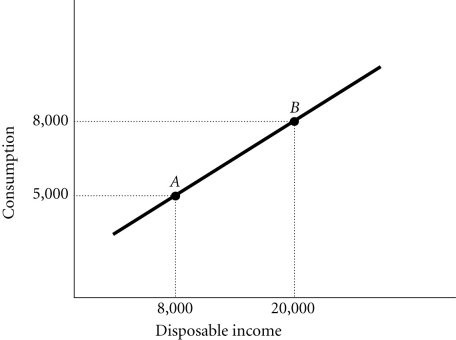 Figure 1.6Refer to Figure 1.6. The slope of the line between Points A and B is
A. 0.25.
B. 4.
C. -0.25.
D. -4.
Answer: A
You might also like to view...
If the percentage increase in the quantity supplied is smaller than the percentage increase in the price, the supply:
A. is elastic. B. is inelastic. C. is perfectly elastic. D. is unit elastic.
Scarcity
a. Can be eradicated with sufficient economic growth. b. Could be eradicated if we could just eliminate greed. c. Can never be eradicated d. Both a. and b. are true
Suppose a fishing boat currently brings 10,000 fish to market and earns a profit of $40,000 when the price of fish is $8 . Suppose the boat dealer had overcharged the boat owner for the boat. Upon receiving a refund of $25,000 from the dealer, what will happen to the ATC of producing 10,000 fish?
a. increases by $25 b. increases by $2.50 c. does not change d. decreases by $2.50 e. decreases by $25
Consider a competitive industry and a price-taking firm that produces in that industry. The market demand and supply functions are estimated to be: Demand: Qd = 10,000 ? 10,000P + 1.0MSupply: Qs = 80,000 + 10,000P ? 4,000PIwhere Q is quantity, P is the price of the product, M is income, and PI is the input price. The manager of the perfectly competitive firm uses time-series data to obtain the following forecasted values of M and PI for 2015: = $50,000 and
  I = $20The manager also estimates the average variable cost function to beAVC = 3.0 ?
0.0027Q + 0.0000009Q2Total fixed costs will be $2,000 in 2015. What is the price forecast for 2015? A. $2.50 B. $3 C. $2 D. $2.75 E. none of the above