Evaluate.-  ?
? 
A. 
B. - 
C. - 
D. 
Answer: B
You might also like to view...
Graph the inequality.x > 3 ![]()
A. ![]()
B. ![]()
C. ![]()
D. ![]()
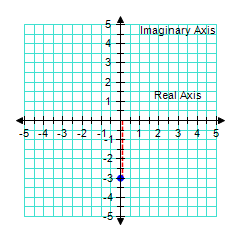
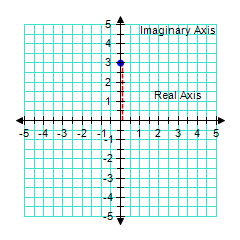
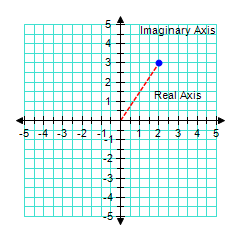
Plot the complex number 2.
 ?
?
A. 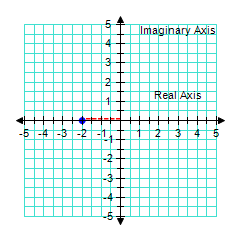
B. 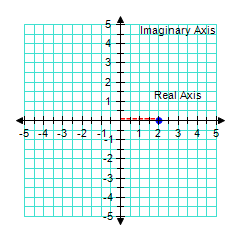
?
C.
D.
E.
Which of the following truth tables is correct? ? ? p q p or q T T T T F F F F F
A. ?
| p | q | p or q |
| T | T | T |
| T | F | F |
| F | F | F |
B. ?
| p | q | p and q |
| T | T | T |
| F | T | F |
| T | F | T |
C. ?
| p | q | Not(p) and Not(q) |
| T | T | F |
| F | F | T |
| F | T | F |
D. ?If p and q are true, then at least p or q is true.
E. ?If p or q is false, then either p or q is false.
Analyze the graph of the given function f as follows:(a) Determine the end behavior: find the power function that the graph of f resembles for large values of |x|.(b) Graph f using a graphing utility.(c) Find the x- and y-intercepts of the graph.(d) Use the graph to determine the local maxima and local minima, if any exist. Round turning points to two decimal places.(e) Use the information obtained in (a) - (d) to draw a complete graph of f by hand. Label all intercepts and turning points.(f) Find the domain of f. Use the graph to find the range of f.(g) Use the graph to determine where f is increasing and where f is decreasing.f(x) = x3 - 0.4x2 - 2.5861x + 3.0912
What will be an ideal response?