Analyze the graph of the given function f as follows:(a) Determine the end behavior: find the power function that the graph of f resembles for large values of |x|.(b) Graph f using a graphing utility.(c) Find the x- and y-intercepts of the graph.(d) Use the graph to determine the local maxima and local minima, if any exist. Round turning points to two decimal places.(e) Use the information obtained in (a) - (d) to draw a complete graph of f by hand. Label all intercepts and turning points.(f) Find the domain of f. Use the graph to find the range of f.(g) Use the graph to determine where f is increasing and where f is decreasing.f(x) = x3 - 0.4x2 - 2.5861x + 3.0912
What will be an ideal response?
(a) For large values of |x|, the graph of f(x) will resemble the graph of y = x3.
(c) y-intercept: (0, 3.0912), x-intercept: (-1.87, 0)
(d) Local maximum at (-0.80, 4.39); Local minimum at (1.07, 1.09)
(e) 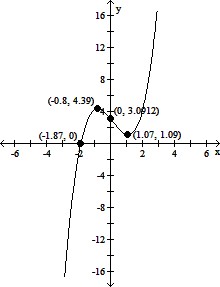
(f) domain of f: all real numbers; range of f: all real numbers
(g) f is increasing on (-?, -0.80) and (1.07, ?); f is decreasing on (-0.80, 1.07)
You might also like to view...
Evaluate the expression using exponential rules. Write the result in standard notation.
A. 0.008 B. 0.08 C. 8,000,000 D. 800,000
Find the vertex for the parabola whose equation is given.y = -x2 - 4x + 3
A. (-4, 3) B. (2, -9) C. (2, -1) D. (-2, 7)
Find the axis of symmetry of the quadratic function.f(x) = (x + 5)2 + 7
A. y = -7 B. x = 5 C. y = 7 D. x = -5
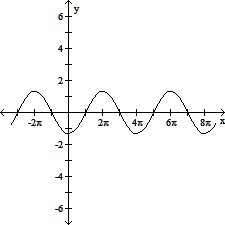
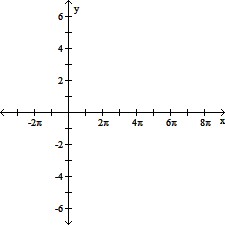
Graph the sinusoidal function using key points.y =  cos
cos
A. 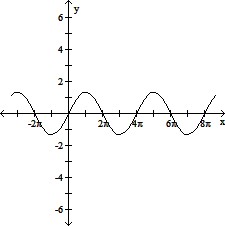
B. 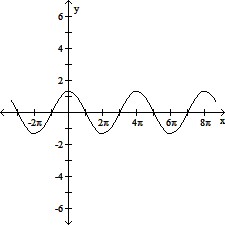
C. 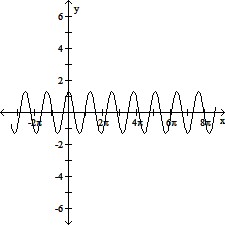
D.