Provide an appropriate response.Suppose you have to develop a model to predict snowfall for the upcoming winter based on data from previous winters. Consider the table of annual snowfall over the last five years: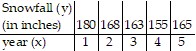 Would it be possible to come up with one model that predicted very low amounts of snowfall and another that predicted very high amounts of snowfall? How so? If you were employed by a ski resort to come up with a model, what type of model would you use? What could be done to try to reduce the chance of coming up with such different models?
What will be an ideal response?
Linear Regression would provide a low snowfall prediction, and quadratic regression would provide a high snowfall prediction. Because ski resorts depend on snowfall, a model that predicts a greater amount of snow would be more useful for advertising purposes. Considering the pattern of snowfall over a longer period of time would provide a more accurate prediction than simply considering a five year period and hence would reduce the potential for finding conflicting models.
You might also like to view...
Describe the given set of points with a single equation or with a pair of equations.The circle of radius 3 centered at the point (7, -6, 6) and lying in a plane perpendicular to the 
A. (y + 6)2 + (z - 6)2 = 9 and x = 7
B.  2+
2+  2+ 1 = 9
C. (y + 6)2 + (z - 6)2 = 9 and y + z = 0
D.  2 +
2 +  2 = 9 and x = 7
Integrate the function. 
A. 
B.  - 13
- 13
C. 
D. 133/2
Provide an appropriate response.What real numbers x satisfy the equation  =
=  ?
?
A. {x|x ? real numbers} B. {x|x ? integers} C. {x|x = 0} D. ?
The circle graph shows the results of the student council presidential election. The complete circular area represents 100% of the votes.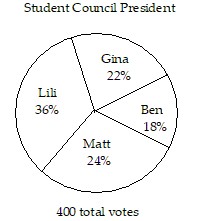 The circle graph shows what percent of the vote each person received.Who got the fewest votes?
A. Lili B. Matt C. Ben D. Gina