The following table shows values of annual real GDP per capita over time. Use it to answer the next question.1810$1,5001860$2,1001910$3,9001960$18,0002010$43,600Between which years was the rate of growth in real GDP per capita the highest?
A. 1960 to 2010
B. 1860 to 1910
C. 1810 to 1860
D. 1910 to 1960
Answer: D
You might also like to view...
The self-correcting tendency of the economy means that falling inflation eventually eliminates:
A. exogenous spending. B. recessionary gaps. C. expansionary gaps. D. unemployment.
If we compare the Canadian natural unemployment rate to the U.S. natural unemployment rate, we find that for most years since 1980
A) the Canadian rate is higher, possibly the result of higher unemployment benefits in the United States for most of those years. B) the U.S. rate is higher, possibly the result of greater job search within a larger country. C) they are essentially the same because we have a lot in common. D) the Canadian rate is higher, possibly the result of higher unemployment benefits in Canada for most of those years. E) The U.S. rate is higher, possibly the result of more structural change occurring in the United States.
The North American Free Trade Agreement affects trade between
a. the United States, Cuba, and Brazil b. the United States, Canada, and Mexico c. the United States, Puerto Rico, and Cuba d. Brazil, Bolivia, Peru, and Columbia e. China and the United States
Assume that all firms in this industry have identical cost curves, and that the market is perfectly competitive.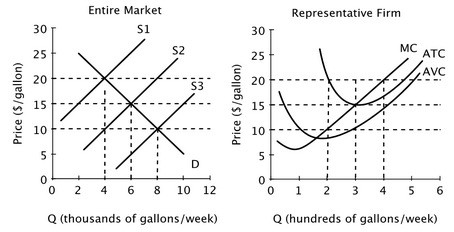 In the long run, the equilibrium price will be ________ per gallon, and each firm's profit-maximizing quantity will be ________ gallons per week.
A. $20; 400 B. $15; 300 C. $20; 4,000 D. $15; 6,000