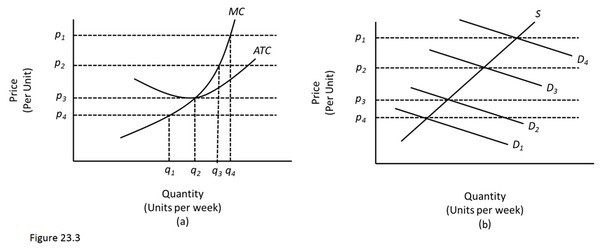
 In Figure 23.3, diagram "a" presents the cost curves that are relevant to a firm's production decision, and diagram "b" shows the market demand and supply curves for the market. Use both diagrams to answer the following question: In Figure 23.3, if market demand is at D1, the firm should
A. Produce q1.
B. Leave the market.
C. Shut down.
D. Do any of the above depending on the position of the AVC and the length of the time period.
Answer: D
You might also like to view...
The balance of payments is in equilibrium when
A) the sum of the current account balance and capital account balance is zero. B) net exports are zero. C) net foreign investment is zero. D) real foreign investment is equal to net exports.
The long-run average total cost curve is U-shaped because:
a. a firm initially experiences economies of scale and then diseconomies of scale. b. the law of diminishing returns to a factor sets in beyond a certain level of output. c. a firm initially experiences diseconomies of scale and then economies of scale. d. division of labor keeps labor productivity constant irrespective of expansion or contraction in production. e. the efficiency of capital increases over a period of time.
In the ____________, households work and receive payment from firms.
A. financial investment market B. financial capital market C. labor market D. savings market
The basic idea of maximization can be stated as follows:
What will be an ideal response?