The bond supply curve
A) shows the quantity of bonds lenders are willing to supply as bond prices change.
B) shows the quantity of bonds lenders are willing to supply as interest rates change.
C) shows the quantity of bonds borrowers are willing to supply as bond prices change.
D) is represented by a downward-sloping line when the price of bonds is on the vertical axis and the quantity of bonds supplied is on the vertical axis.
C
You might also like to view...
Use the following graph for a perfectly competitive firm to answer the next question.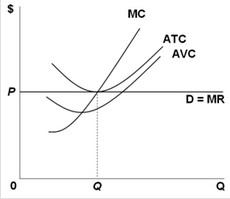 At its short-run equilibrium point, the firm's
A. marginal revenue equals its average variable cost. B. marginal cost equals its average fixed cost. C. marginal revenue equals its average total cost. D. marginal cost equals its average variable cost.
Refer to the above figure. Suppose demand is D2 and then increases to D3. Economic rent after the change is
A) zero. B) area CIHF. C) area CIGO. D) area BJC.
Which of the following is an example of inelastic demand?
a. A 10 percent increase in the price of milk leads to a 20 percent decrease in the quantity demanded of milk. b. A 10 percent increase in the price of milk leads to a 10 percent decrease in the quantity demanded of milk. c. A 10 percent increase in the price of milk leads to a 5 percent decrease in the quantity demanded of milk. d. A 10 percent increase in the price of milk leads to a 10 percent increase in the quantity demanded of milk. e. A 10 percent increase in the price of milk leads to a 5 percent increase in the quantity demanded of milk.
If $1 = 1.50 euros, then what is the equivalent euro price of a clock selling for $30 in the United States?
a. 20 euros b. 30 euros c. 45 euros d. 60 euros