Select the correct graph of the following function.
?

?
A. ?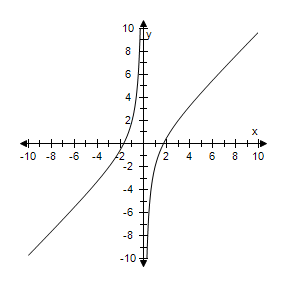
B. ?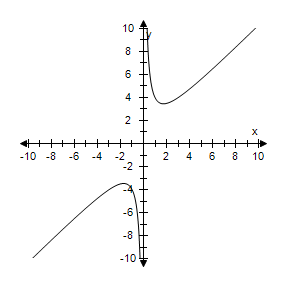
C. ?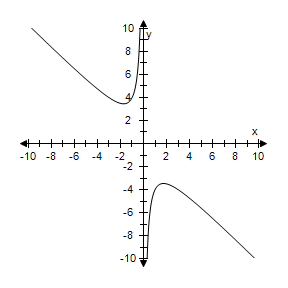
D. ?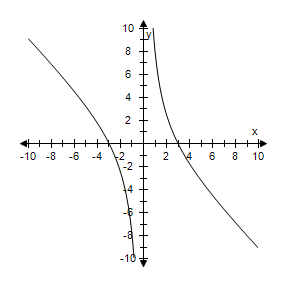
E. ?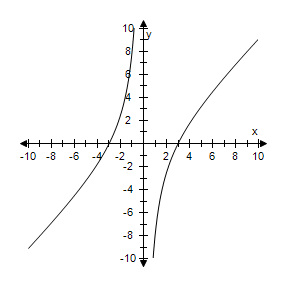
Answer: E
Mathematics
You might also like to view...
Divide in the indicated base.25006 ÷ 46
A. 3136 B. 4236 C. 4106 D. 4136
Mathematics
The figure shows the percentage of the U.S. population, f(x), made up of teachersas a function of time, x, where x is the number of years after 1900. Use the graph to solve the problem.  In which year did the percentage of teachers in the U.S. reach a minimum?
A. 2000 B. 1900 C. 1970 D. 1990
Mathematics
Find the derivative of the function.y = 
A. 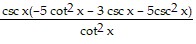
B. 
C. 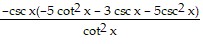
D. 
Mathematics
Write a statement that represents the relationship between the following.A = {x } and 2
A. 2 ? A B. 2 = A C. 2 ? A D. 2 ? A
Mathematics