Graphically express a production possibilities curve. What do points on, inside and outside the curve represent? What does a rightward shift of the curve represent? How is economic growth expressed in terms of the production possibilities model?
The production possibilities curve will bow out from the origin. A point on the curve represents efficiency. A point inside represents inefficiency. A point outside the curve is currently unattainable (it is a combination of production we cannot currently produce given our limited resources and technology; although that point may be attainable if we acquire more resources, technology, or generally increase our production possibilities). A rightward shift in the curve represents an increase in production possibilities. Because economic growth means an increase in a nation's production possibilities over time, then it is expressed as a rightward shift of the production possibilities curve.
You might also like to view...
A demerit good is a good that __________
Fill in the blank(s) with the appropriate word(s).
Suppose that the CPI in 2009 is 220 and that the inflation rate is 5% in 2010 . What is the CPI in 2010?
Assets minus liabilities equal:
A. current income minus spending on current needs. B. wealth. C. saving. D. investment.
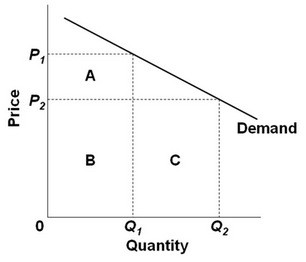 Refer to the above diagram. The quantity difference between areas A and C for the indicated price reduction measures:
A. monopoly price. B. marginal revenue. C. a welfare or efficiency loss. D. marginal cost.