Government regulations
A) have no impact on supply.
B) only change the quantity supplied, not the supply curve.
C) are generally ineffective due to lobbying by suppliers.
D) can change both quantity supplied as well as the supply curve.
D
You might also like to view...
Railway engines create sparks, which sometimes set fire to crops planted near the tracks. A large number of farmers are affected, and transactions costs prevent the farmers and the railroad from negotiating bribes or side payments. The price of railway service is $250 per train, and each train causes $50 of crop damage. The accompanying diagram shows the relevant market for railway service.
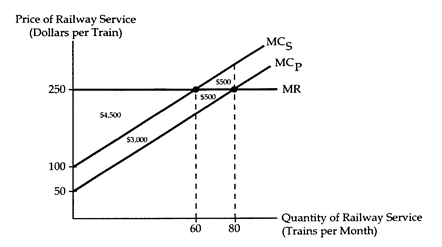
(i) Suppose a Pigovian tax of $50 per train is imposed on the railroad. By how much will social gain increase?
(ii) Suppose that the farmers can move their crops away from the tracks at a cost of $2,400 per month. If the goal is to achieve economic efficiency, who should be made liable for the crop damage? What will be the resulting social gain?
(iii) Suppose that farmers still have the option of moving their crops as described in part ii. Also suppose that the railroad can install safety equipment that will prevent the engine sparks at a cost of $25 per train. If the goal is to achieve economic efficiency, who should be made liable for the crop damage? What will be the resulting social gain?
To judge a statistical relationship, should a researcher preferably rely on a small sample or a large sample? Explain your answer
What will be an ideal response?
The willingness of consumers to buy a product at different prices is shown on a
A) demand curve. B) production possibilities frontier. C) supply curve. D) marginal cost curve.
Graphically, a firm's total cost is equal to the area of the:
a. triangle formed under the demand curve. b. rectangle formed under the demand curve at a given price and quantity combination. c. rectangle formed under the average-total-cost curve at a given ATC and quantity combination. d. triangle formed by a line segment between the demand and average-total-cost curves. e. triangle formed by a line segment between the horizontal axis and the average-total-cost curves.