Use the data in the table to make a line graph showing the average acreage (in acres) of U.S. farms for the years 1950 through 1990.
?
YearNumber of U.S. farms (in millions)Average size of U.S. farms (acres)19505.623419604.033019702.939919802.444119902.147820002.2439?
A. 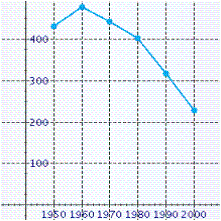
B. 
C. 
D. 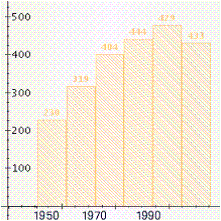
E. 
Answer: C
You might also like to view...
Evaluate the integral.
A.  +C
+C
B.  + C
+ C
C. 7x ln(7)(x - ln 7) + C
D.  + C
+ C
Make a line graph of the data.The following table shows the median teacher's salary in District X over several years. Use time on the horizontal scale for your line graph.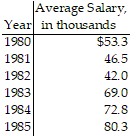
What will be an ideal response?
Use a graphing calculator to solve the system of equations. Round your solutions to one decimal place.1.9x + 15.8y + 4.5z = 4.94.6x - 7.0y + 0.9z = -3.13.6x + 15.5y + 4.3z = 8.0
A. (0.3, 0.2, -0.7) B. (1.6, 1.1, -3.4) C. (0.7, 0.5, -1.5) D. (3.6, 2.4, -7.4)
Solve. Remember to insert units when writing your answer.The two sticks used to make a kite have lengths of 0.9 m and 51 cm. What total length of wood must be ordered for the sticks if 29 kites are to be built?
A. 1.41 m B. 40.89 m C. 14,816.1 m D. 51.9 m