Solve the problem.The graph shows the percentage of students in a certain state through grade 12 who were home-schooled in 2008 and 2016. What impression does the roofline in the visual display imply about what occurred in 2009 through 2015? How might this be misleading?
What will be an ideal response?
The roofline gives the impression that the percentage of home-schooled students grew at the same rate each year between the years shown, which might not have happened.
You might also like to view...
Place the correct symbol, >, <, or =, in the blank in the given pair of fractions.


A. = B. > C. <
Determine the size of the sample space for the experiment described.A group of 19 people are assigned numbers 1 through 19. State the number of elements in the sample space of the event choosing a person with a number 5 or less.
A. n(S) = 1 B. n(S) = 4 C. n(S) = 5 D. n(S) = 19
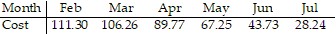
Solve the problem.The data below represent the average monthly cost of natural gas in an Oregon home. 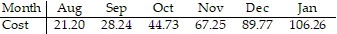
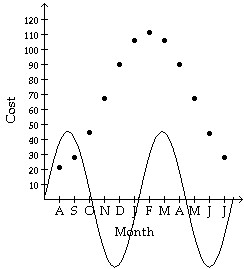 Above is the graph of 45.05 sin x superimposed over a scatter diagram of the data. Find the sinusoidal function of the form
 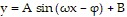 which best fits the data.
A. y = 45.05 sin  + 21.20
B. y = 45.05 sin  + 21.20
C. y = 45.05 sin  + 66.25
D. y = 45.05 sin  + 66.25
Solve the problem.Write an equivalent statement using the distributive property.13 + 7
+ 7 =
=
A. (13 + 7)
B. (91)
C. (13 + 7)
D. (91)