Refer to the graphs below. They show the long-run average total cost (LRATC) for a product. Which graph would most probably be applicable to a natural monopoly?
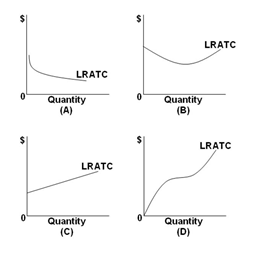
A. Graph A
B. Graph B
C. Graph C
D. Graph D
A. Graph A
You might also like to view...
The definition of poverty that is based on percentage of median income recognizes that
a. poverty is a relative concept b. poverty has an important cultural component that goes beyond relationships between individual incomes c. there is a vicious circle of poverty that keeps the poor locked in poverty d. poverty is about real people e. income is a sufficient measure of economic well-being
Use an isocost-isoquant diagram to explain how a firm determines the least cost combination of labor and capital to produce a given level of output. What is true of the marginal product per dollar at the least cost combination of capital and labor? Why?
What will be an ideal response?
Annie had a job as a human resource manager of a restaurant chain that went out of business due to a downturn in the economy. She looked for work for six months and gave up because she was convinced that she could not find a suitable job to fit her skill set. In this instance she would be counted as a
A. reentrant. B. discouraged worker. C. labor force participant. D. job leaver.
Hector has $1,000 a month to spend on clothing and food. The price of clothing is $50 and the price of food is $20. What is the equation for Hector's budget constraint?
A. Clothing + Food < $1,000 B. $50 × Clothing + $20 × Food = $1,000 C. $50 × Clothing + $20 × Food ? $1,000 D. ($50 × Clothing) / ($20 × Food) = $1,000