When looking at this graph for the welfare effects of a price ceiling, the loss to producers created by the price ceiling is ______.
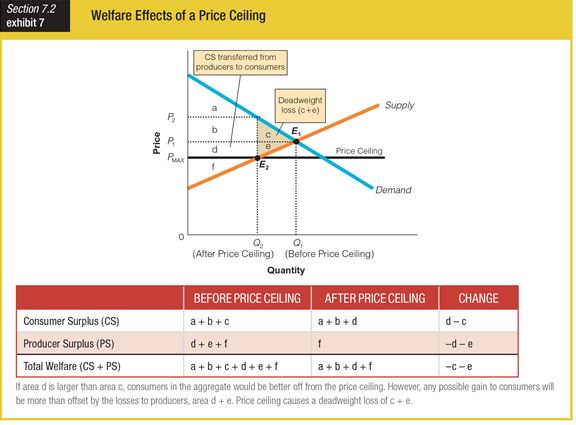
a. area d + e
b. everything below the supply curve
c. everything above the demand curve
d. area c + e
a. area d + e
You might also like to view...
The supply curve shows the
A) marginal benefit of a firm producing another unit of a good. B) dollars' worth of other goods and services we are willing to give up to get another unit of the good. C) minimum price that firms must receive to supply a certain quantity of a good. D) producer surplus of producing the good. E) maximum price that firms will accept in order to supply a certain quantity of a good.
If the entire Social Security payroll tax were paid by the employers _____
a. the workers would be better off b. labor costs would increase c. the price of all non-labor goods would rise d. the employees after-tax wage would be unaffected
A perfectly competitive firm faces a downward sloping market demand curve
a. True b. False Indicate whether the statement is true or false
A firm finds that at its MR = MC output, its TC = $1,000, TVC = $800, TFC = $200, and total revenue is $900. This firm should:
A. shut down in the short run. B. produce because the resulting loss is less than its TFC. C. produce because it will realize an economic profit. D. liquidate its assets and go out of business.