The figure below represents the effects in the labor markets due to migration. Here, the world has been divided into a high-income "North" (left panel) and a low-income "South" (right panel). Dn and Sn are the labor demand and the labor supply curves in North. Ds and (Sr + Smig) are the labor demand and pre-migration labor supply curves in South. Sr is the post-migration labor supply curve in South. The value c is the cost of migrating.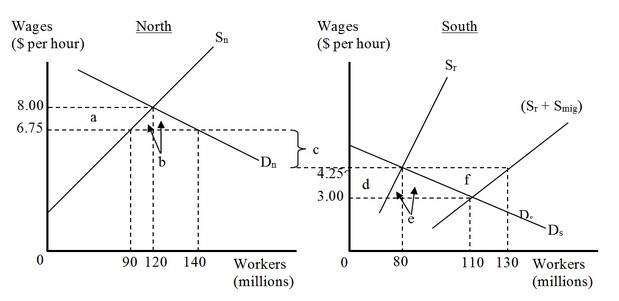 The world's net gain due to migration is represented by the area
A. (a + f).
B. (b + f).
C. (a + b).
D. (e + f).
Answer: B
You might also like to view...
A document that promises to pay specified sums of money on specified dates and is a debt to the issuer is called
A) a bond. B) depreciation. C) a stock. D) net investment. E) gross investment.
Assume that the central bank increases the reserve requirement. If the nation has low mobility international capital markets and a flexible exchange rate system, what happens to the real risk-free interest rate and the nominal value of the domestic currency in the context of the Three-Sector-Model?
a. The real risk-free interest rate rises, and nominal value of the domestic currency falls. b. The real risk-free interest rate falls, and nominal value of the domestic currency falls. c. The real risk-free interest rate rises, and nominal value of the domestic currency remains the same. d. The real risk-free interest rate rises, and nominal value of the domestic currency rises. e. There is not enough information to determine what happens to these two macroeconomic variables.
Refer to Figure 3.1. If one of the graphs represents the total cost of an activity, which other graph best represents the marginal cost of the activity?
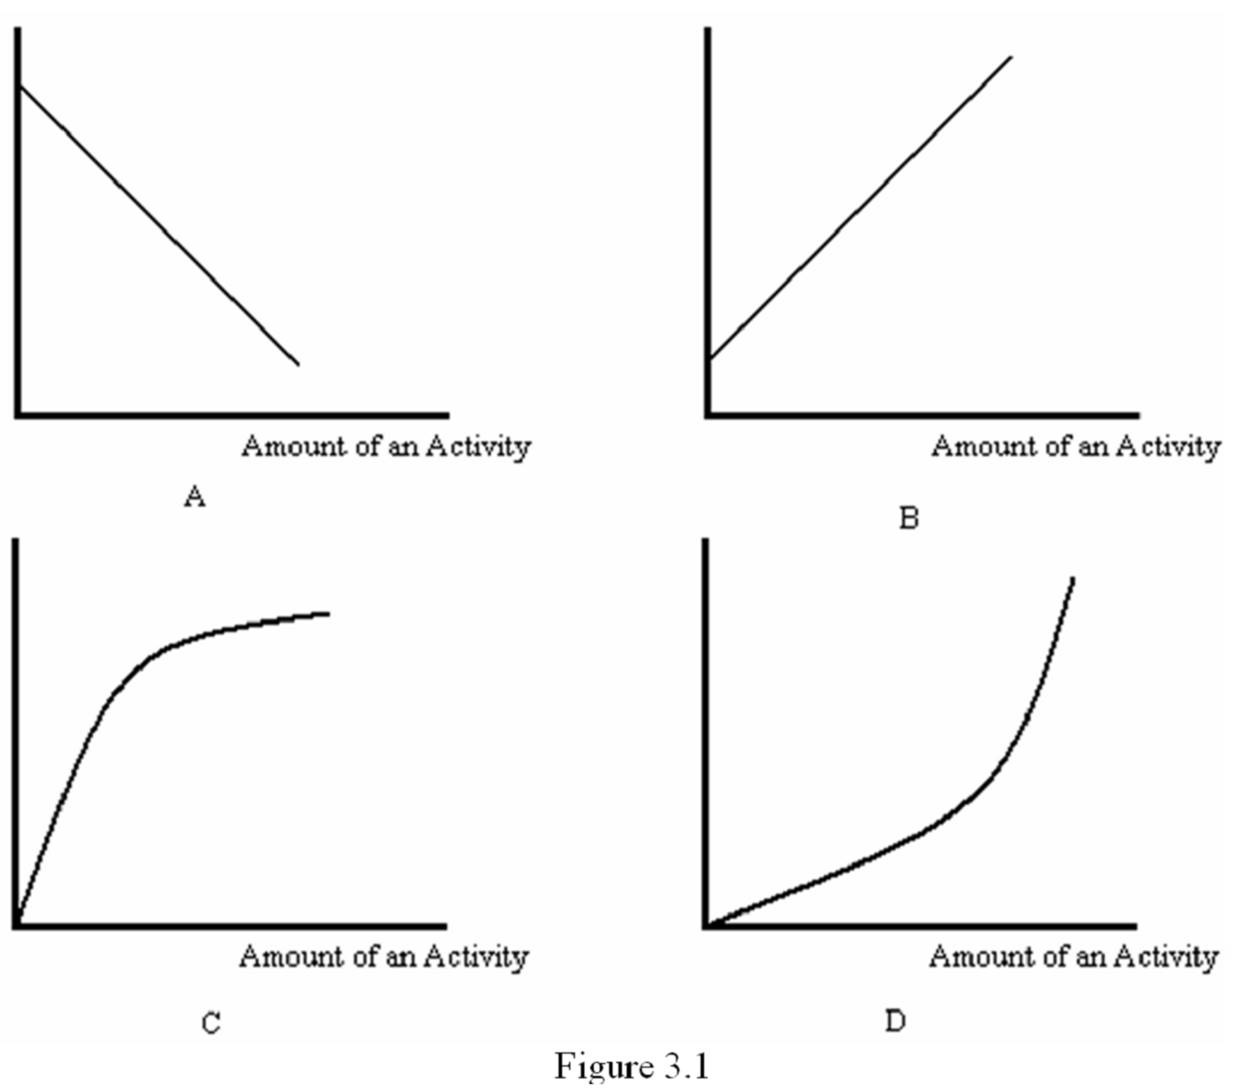
A. A
B. B
C. C
D. D
When accounting profits are positive, economic profits
A) must be positive. B) will be negative. C) will equal zero. D) could be positive, negative or zero.