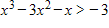
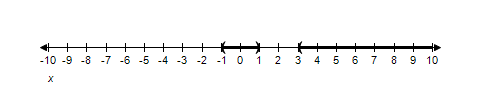
Solve the inequality and graph the solution on the real number line.
?
?
A. 

B.

C.


D.

E.


Answer: A
Mathematics
You might also like to view...
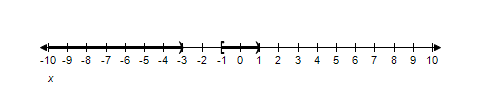
Construct a histogram for the given data. The following data are the number of hours spent preparing for a test by a sample of 24 high school students. The times (in hours) are as follows:  Use the given class intervals in the table below to construct a relative frequency histogram for the data.
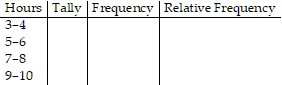
What will be an ideal response?
Mathematics
Solve the inequality. Write the answer in set-builder notation.6(t + 7) < 12(t - 4)
A. 
B. 
C. 
D. 
Mathematics
In the figure below, a = 8, and  Use this information to solve the parallelogram for c. The diagonals of the parallelogram are represented by c and d. Round answer to two decimal places.
A) 10.00 B) 7.21 C) 10.93 D) 9. 69 E) 12.17
Mathematics
Find the LCM of the set of numbers.18, 48
A. 5184 B. 144 C. 864 D. 18
Mathematics