Graph. Label any intercepts and determine the slope of the line. If the slope is undefined, state this.x = 6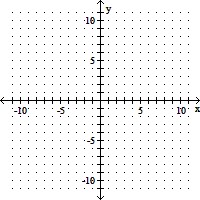
A. x-intercept: (0, 6), m: 0
B. x-intercept: (0, 0), m: 6
C. x-intercept: (6, 0), m: undefined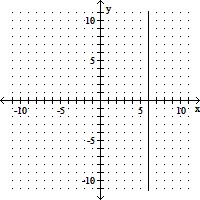
D. x-intercept: (6, 0), m: 

Answer: C
You might also like to view...
The equation of change for a certain population is
 .
.
A: Plot the graph of  versus N.B: Explain in practical terms what the graph in part A shows us.C: What are the equilibrium solutions for this equation of change?D: What is happening to the population when it reaches the value of an equilibrium solution?
What will be an ideal response?
Graph the function by starting with the graph of the basic function and then using the techniques of shifting, compressing, stretching, and/or reflecting.f(x) =  + 1
+ 1
A. 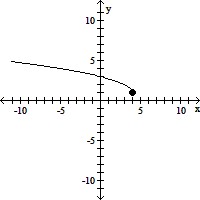
B. 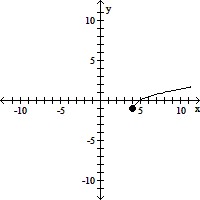
C. 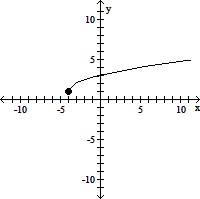
D. 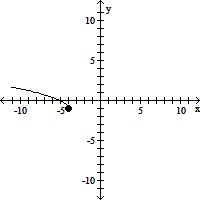
Find the values of the variables for which the statement is true, if possible.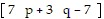 =
= 
A. k = -5; p = -2; q = 0 B. k = 5; p = 2; q = 0 C. k = 2; p = 7; q = -7 D. k = 5; p = 0; q = 0
f is a joint probability density function on D. Find 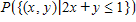 .
?
.
?
 ?
?
A. ?
B. ?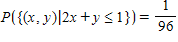
C. ?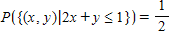
D. ?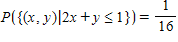
E. ?