Refer to Figure 27-11. In the graph above, the shift from AD1 to AD2 represents the total change in aggregate demand. If government purchases increased by $50 billion, then the distance from point A to point B ________ $50 billion
A) may be greater than or less than B) would be less than
C) would be greater than D) would be equal to
C
You might also like to view...
Use the following graphs to answer the next question.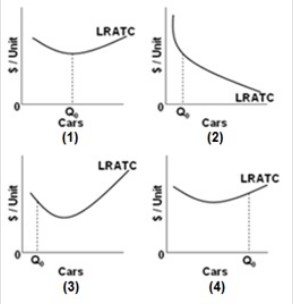 For which graph are there economies of scale throughout the entire range of output of cars?
A. Graph 1 B. Graph 2 C. Graph 3 D. Graph 4
Suppose antitheft auto alarms are produced in a price-taker market that is initially in long-run equilibrium. It is estimated that only 23 percent of all autos have alarms. Due to rising auto theft, Congress mandates alarms in every vehicle. Assume complete compliance. If the industry is an increasing cost industry, price will
a. increase in both the short run and long run. b. decrease in both the short run and long run. c. increase in the short run but not in the long run. d. decrease in the short run but not in the long run.
The conjecture that R&D expenditures as a percentage of firms' sales first rise, reach a peak, and then fall as industry concentration rises is known as the:
A. inverted-U theory of R&D. B. average product of R&D theory. C. bell-shaped-curve theory of product innovation. D. theory of increasing and diminishing returns.
A set of indifference curves on a graph is called
A. a budget map. B. a cluster. C. an indifference map. D. a difference map.