For the given graphical representation of vector v, estimate a1 and a2 so that  and calculate
  .
.
A. a1 = 6 a2 = 8;  = 10
= 10
B. a1 = -6, a2 = 8;  = 3.7
= 3.7
C. a1 = -6, a2 = 8;  = 100
= 100
D. a1 = -6, a2 = 8;  = 10
= 10
Answer: D
You might also like to view...
Solve the following system of equations. Round your answers to two decimal places.

What will be an ideal response?
Rewrite the statement in the form "if p, then q".|y| = 7 only if y = ± 7.
A. If y = ±7, then |y| = 7. B. If |y| ? 7, then y = ±7. C. If |y| = 7, then y = ±7. D. If y ? ±7, then |y| = 7.
Simplify the expression.-(9)
A. 0 B. -1 C. 9 D. -9
Solve the problem.Data regarding the amount spent by a government department is represented in the following graph. Find the change in amount spent for the years shown in the graph. Is the graph a straight line?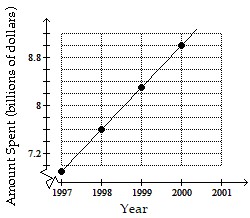
A. Change for each year: $0.18 billion; yes B. Change for each year: $0.72 billion; yes C. Change from 1998 to 1999: $0.72 billion, change from 1999 to 2000: $0.18 billion; no D. Change for each year: $0.38 billion; yes