The line graph shows the recorded hourly temperatures in degrees Fahrenheit at an airport. 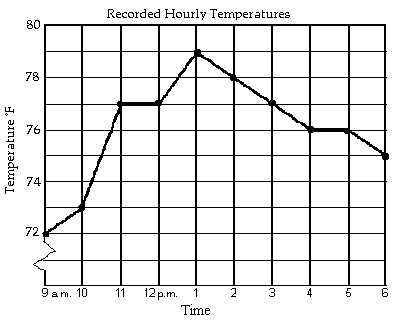 At what time was the temperature 79°?
A. 12 p.m.
B. 6 p.m.
C. 1 p.m.
D. 2 p.m.
Answer: C
You might also like to view...
Use the data to construct a frequency distribution.The ages of 30 swimmers who participated in a swim meet are as follows:18, 36, 30, 33, 40, 18, 50, 59, 19, 43, 51, 19, 26, 28, 41, 20, 29, 20, 58, 49, 24, 37, 46, 53, 33, 22, 22, 41, 30, 49Construct a grouped frequency distribution for the data. Use the classes src="https://sciemce.com/media/4/ppg__rrrr0613190819__f1q110g5.jpg" alt="" style="vertical-align: -4.0px;" />.
What will be an ideal response?


Find the mode or modes.5, 9, 49, 3, 2, 8, 77, 1, 4, 16
A. 8 B. No mode C. 9 D. 16.8
Interpret the components and their concentrations for an IV fluid labeled D5 .9NS.
What will be an ideal response?
Multiply.(60.060)(10)
A. 5956 B. 620.6 C. 600.6 D. 6006