Graph the elements of the set on a number line.
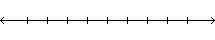
A. ![]()
B. ![]()
C. ![]()
D. ![]()
Answer: A
You might also like to view...
Answer the question.The graph below shows estimated world population for the period 4000 BC - 2000 AD. Note that the logarithm of the world population and not actual population is plotted on the vertical axis. This means, for example, that when the graph reaches 7 on the vertical scale, world population is 107 and when the graph reaches 9 on the vertical scale, world population is 109. Log World Population  ? -4000 -2000 0 2000Why must the graph be interpreted with care? If the graph is not interpreted with care what misleading impression might one have of world population during the period 4000 BC - 2000 AD? Why do
you think that the graph was presented in this form? What will be an ideal response?
Use unit ratios or conversion factors to change to the units indicated. Round to the nearest tenth, if necessary.6 km to miles
A. 6.4 mi B. 3.7 mi C. 9.7 mi D. 5.7 mi
Identify the following as rational or irrational. If the number is rational, find the root exactly. If the number is irrational, approximate the number to the nearest thousandth when necessary.
A. Rational; 8 B. Rational; 72 C. Irrational; 2.881 D. Rational; 24
Find the exact value of the real number y.y = csc-1 (2)
A. - 
B. - 
C. 
D. 