Solve the problem.The graph below shows the number of tuberculosis deaths in the United States from 1989 to 1998. 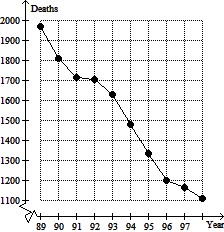 Estimate the average rate of change in tuberculosis deaths from 1993 to 1995.
A. About -80 deaths per year
B. About -300 deaths per year
C. About -150 deaths per year
D. About -01 deaths per year
Answer: C
You might also like to view...
Graph the polar equation.r = -  + cos ?
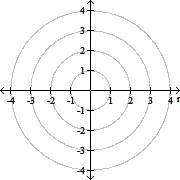
A. 
B. 
C. 
D. 
Use the following advice from most financial advisors to solve the problem. ? Spend no more than 28% of your gross monthly income for your mortgage payment. ? Spend no more than 36% of your gross monthly income for your total monthly debt.Round all calculations to the nearest dollar, if necessary.Suppose that your gross annual income is $60,000.(a) What is the maximum amount you should spend each month on a mortgage payment?(b) What is the maximum amount you should spend each month for total credit obligations?(c) If your monthly mortgage payment is 75% of the maximum amount you can afford, what is the maximum amount you should spend each month for all other debt?
A. (a) $1400; (b) $1800; (c) $1050 B. (a) $16,800; (b) $21,600; (c) $9000 C. (a) $1400; (b) $1800; (c) $750 D. (a) $1400; (b) $1800; (c) $50
Estimate the sum or difference by first rounding as indicated.Estimate by first rounding to the nearest hundred.9366
A. 8000 B. 7700 C. 7623 D. 7600
Simplify.(xy)3
A. 3xy B. x3y C. xy3 D. x3y3