A demand curve is graphed to show the relationship of the _______________ of a good on the vertical axis with the _____________ of the good on the horizontal axis.
a. price/quantity
b. quantity/demand
c. demand/utility
d. utility/price
a. price/quantity
A demand curve is graphed to show the relationship of the price of a good on the vertical axis with the quantity of the good on the horizontal axis.
You might also like to view...
The above table gives data on two variables. If these data were graphed, the slope of the line would be
A) 1. B) -2. C) 2. D) -4.
In the figure above, the shift in the demand curve for U.S. dollars from D0 to D1 could occur when
A) the expected future exchange rate decreases. B) the U.S. interest rate rises. C) people expect that the dollar will depreciate. D) foreign interest rates increase.
If Slick Shades has a constant marginal cost of production equal to $80 and the distributors have a constant marginal cost of distribution equal to $30, what is the profit-maximizing number of sunglasses (in hundreds) for Slick Shades to produce?
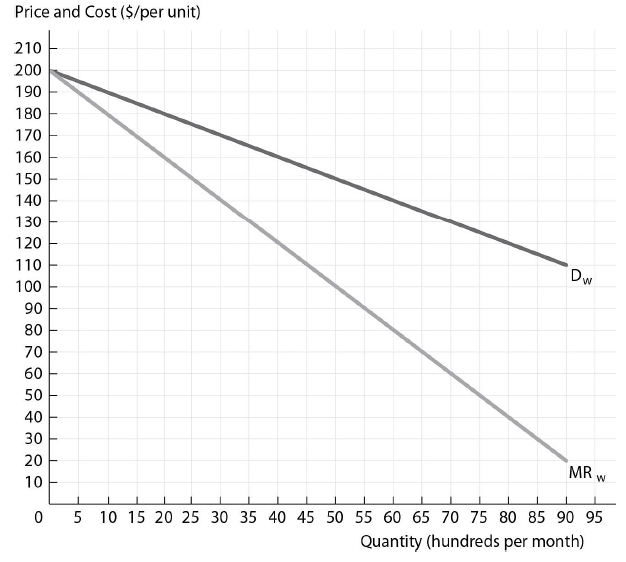
The figure above shows the wholesale demand and marginal revenue curves for Slick Shades Sunglasses, a sunglasses firm with market power. Slick Shades Sunglasses has a constant marginal cost of production and it sells to perfectly competitive independent retail distributors that have a constant marginal cost of distribution.
A) 40
B) 80
C) 55
D) 60
Assume South Korea and Vietnam have the same amount of resources. In a given time period, South Korea can produce 100,000 jackets or 1,000,000 shirts. Vietnam can produce 200,000 jackets or 2,000,000 shirts. This means that
A. South Korea has an absolute advantage in jackets. B. South Korea has a comparative advantage in jackets. C. Vietnam has an absolute advantage in both jackets and shirts. D. Vietnam has a comparative advantage in shirts.