This graph shows the cost and revenue curves faced by a monopoly. 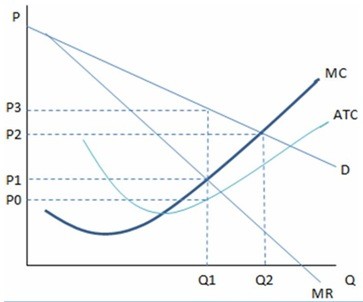 According the graph shown, the profit-maximizing decision of the monopolist would be:
A. Q1, P1.
B. Q2, P2.
C. Q1, P3.
D. Q1, P2.
Answer: C
You might also like to view...
In 1999 the European unemployment rate was ________ that in the United States
A) double B) triple C) equal to D) lower compared to
Which of the following would cause a rightward shift in the demand curve for gasoline?
I. A large increase in the price of public transportation. II. A large decrease in the price of automobiles. III. A large reduction in the costs of producing gasoline. A) I only B) II only C) I and II only D) II and III only E) I, II, and III
Which of the following best describes a firm that is showing economic profits?
a. The firm’s revenue is adequate to cover its explicit costs. b. The payments the firm has made are greater than its implicit costs. c. The firm has taken in enough money to cover its total opportunity costs. d. The per-unit cost of production for the firm is at its minimum.
In a partnership, legal responsibility for all debts is
A) shared by the partners. B) passed to the shareholders. C) paid by the principle owner. D) handled by the bondholders.