Refer to Figure 11.5. An increase in the level of investment is best illustrated by diagram
A) A. B) B. C) C. D) D.
C
You might also like to view...
Dahlia can earn $60,000 a year working at a relatively safe job, or $65,000 a year working at a riskier job
The probability of death from working at the relatively safe job is 1/5,000, and the probability of death from working at the riskier job is 1/1,000. Using the compensating differential approach and the above information, what is the value of Dahlia's life? A) $2 million B) $2.5 million C) $6.25 million D) $25 million
Refer to Table 18-6. Sasha is a single taxpayer with an income of $60,000. What is his marginal tax rate and what is his average tax rate?
A) marginal tax rate = 17%; average tax rate = 21% B) marginal tax rate = 23%; average tax rate = 38% C) marginal tax rate = 38%; average tax rate = 23% D) marginal tax rate = 38%; average tax rate = 24%
Penalties on sellers
What will be an ideal response?
Exhibit 10-6 Aggregate supply curve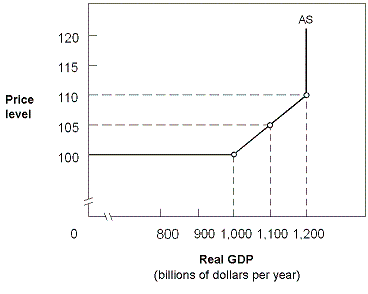 In Exhibit 10-6, when the economy moves from a GDP of $1,000 billion to a GDP of $1,100 billion,
A. higher wages will lower the cost of producing goods. B. real GDP and employment both increase, but only under conditions of constant prices. C. real GDP increases and employment decreases, but only under conditions of price level increases. D. real GDP and employment both increase, but only under conditions of price level increases.