The above figure shows the production possibility frontier for a country. What is the opportunity cost per ton of rice to move from point D to E?
A) 3000 bottles of wine
B) 333 bottles of wine
C) 3 bottles of wine
D) 1/3 of a bottle of wine
E) None of the above answers is correct.
A
You might also like to view...
Refer to the below graphs. (Assume that the pre-migration labor force in Country A is 0d and that it is 0u in country B.) The migration of labor from low-income country B to high-income country A will:
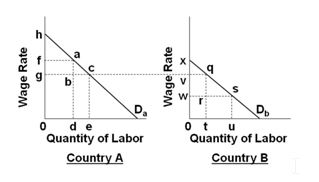
A. Increase domestic output in both countries
B. Decrease domestic output in both countries
C. Increase domestic output in country A and decrease domestic output in country B
D. Decrease domestic output in country A and increase domestic output in country B
The free rider problem suggests that a producer will tend to: i. produce more than the optimal quantity of a public good. ii. produce less than the optimal quantity of a public good. iii. produce the optimal quantity of a public good if it is funded out of tax revenue
a. (i) only b. (ii) only c. (i) and (iii) only d. (ii) and (iii) only
The price-elasticity coefficients are 2.6, 0.5, 1.4, and 0.18 for four different demand schedules,D1, D2, D3, and D4, respectively. A 2-percent increase in price will result in an increase in total revenues in which of the following cases?
What will be an ideal response?
When long-run average costs rise as output increases, the firm is experiencing
A. diseconomies of scale. B. economies of scale. C. constant returns to scale. D. diminishing returns.