This graph demonstrates the domestic demand and supply for a good, as well as a tariff and the world price for that good.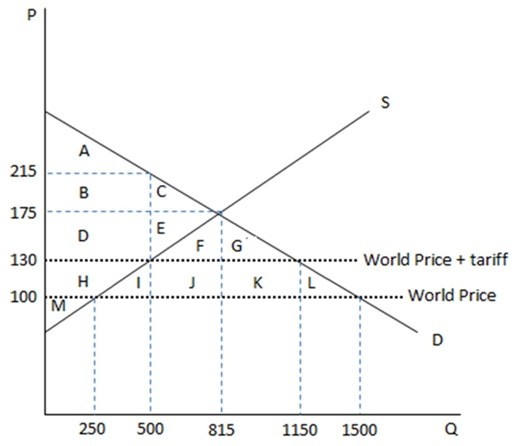 According to the graph shown, if the economy were open to free trade, the domestic quantity supplied would:
A. drop from 815 to 500.
B. increase from 250 to 500.
C. increase from 815 to 1500.
D. drop from 815 to 250.
Answer: D
You might also like to view...
If pure competition doesn't exist in the real world what is the implication for the shape of the demand curve that real-world firms would face?
What will be an ideal response?
What is a private cost of production? What is a social cost of production? When is the private cost of production equal to the social cost of production?
What will be an ideal response?
The formula for the yield to maturity, i, on a discount bond is
A) i = (Face value - Discount price)/Discount price. B) i = (Discount price - Face value)/Discount price. C) i = (Face value - Discount price)/Face value. D) i = (Discount price - Face value)/Face value.
The motivation for collective action is to do things that benefit society as a whole
a. True b. False