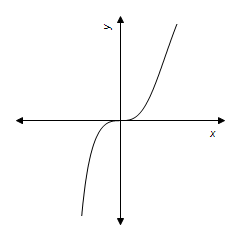
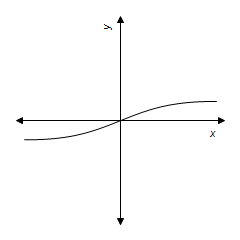
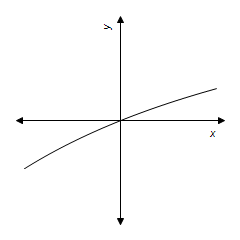
Use a graphing utility to graph the equation. Use the graph to approximate the values of x that satisfy each inequality.
?
Equation:

?
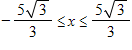
Inequality:

?
A. ?
B. ?

C. ?
D. ?
E. ?

Answer: C
You might also like to view...
Divide and reduce to lowest terms.6 ÷ 
A. 
B. 9
C. 
D. 
Find the Social Security tax (6.2%), Medicare tax (1.45%), and state disability insurance deduction (1%) for the employee. Assume the employee is under the FICA and SDI maximums at the end of the current pay period and assume that  is paid for any overtime in a
  week. Round to the nearest cent if needed. Hours Reg FICA Medicare SDIEmployee Worked Rate Tax Tax TaxWilson, M. 37.5 $7.50
A. $3.41, $0.80, $0.55 B. $26.16, $6.12, $4.22 C. $17.44, $4.08, $2.81 D. $20.25, $6.89, $5.63
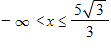
Provide an appropriate response.Fill in the blanks to complete the statement. The graph of P(x) = -0.4(x - 7)2 is a parabola with  x-intercept(s). Its vertex is the
  point of the graph and has coordinates
  .
.
A. two; maximum (or highest); (7, 0) B. one; maximum (or highest); (7, 0) C. one; minimum (or lowest); (7, 0) D. no; maximum (or highest); (-0.4, 7)
Use the Gauss-Jordan method to solve the system of equations. 5x - y + 2z = 2 6x + 7y - 4z = 37 4x - 9y + z = -40
A. (-1, 5, 2) B. (1, 5, 1) C. No solution D. (1, 1, 5)