Exhibit 4-8 Demand and supply curves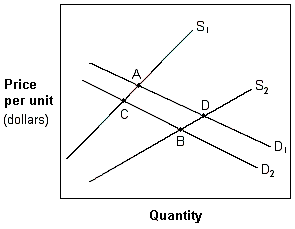
In Exhibit 4-8, a movement from A to C is best described as a(n):
A. increase in the quantity supplied and a decrease in the demand.
B. decrease in the quantity supplied and a decrease in demand.
C. decrease in the quantity supplied and an increase in demand.
D. decrease in the quantity demanded and a decrease in supply.
Answer: B
You might also like to view...
Explain how the price system eliminates a shortage
What will be an ideal response?
The RBC model tells us that
A) as the real wage rate rises, the amount of labor supplied and thus output produced falls. B) as the price level rises, the real wage rises, thus raising the amounts of labor supplied and output produced. C) as the real interest rate rises, the amount of labor supplied and thus output produced rises. D) as the price level rises above the expected price level, actual output rises above the natural real GDP.
Where Es is the elasticity of supply and Ed is the own price elasticity of demand, the fraction of the tax passed on to consumers in the form of higher prices is
A) Es/(Es-Ed). B) Ed/(Es-Ed). C) Es/(Ed-Es). D) Ed/(Ed-Es). E) Ed/Es.
If the economy spends 80 percent of any increase in real GDP, then an increase in investment of $1 billion would result ultimately in an increase in real GDP of:
a. $0. b. $0.8 billion. c. $1.0 billion. d. $5.0 billion.