Graph the function using a solid line and its inverse using a dashed line on the same set of axes.f(x) =  x + 3
x + 3
A. 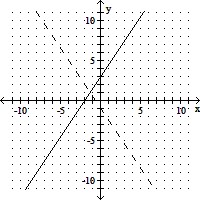
B. 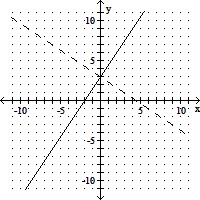
C. 
D. 
Answer: C
You might also like to view...
Find the exact value of the expression.cos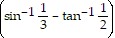
A. 
B. 
C. 
D. 
Use positive rational exponents to rewrite the expression. Assume variables are positive. -2
-2
A. -z4/7
B. 
C. 
D. -z28
Consider the spheres shown in the figure.Explain what is meant by a great circle on a sphere Answer A circle with diameter equal to that of the sphere or A circle with diameter equal to 1.
What will be an ideal response?
Analyze the graph of the given function f as follows:(a) Determine the end behavior: find the power function that the graph of f resembles for large values of |x|.(b) Graph f using a graphing utility.(c) Find the x- and y-intercepts of the graph.(d) Use the graph to determine the local maxima and local minima, if any exist. Round turning points to two decimal places.(e) Use the information obtained in (a) - (d) to draw a complete graph of f by hand. Label all intercepts and turning points.(f) Find the domain of f. Use the graph to find the range of f.(g) Use the graph to determine where f is increasing and where f is decreasing.f(x) = x3 - 0.4x2 - 2.5861x + 3.0912
What will be an ideal response?