Graph the system of inequalities. Shade the region that represents the points of intersection.
A. 
B. 
C. 
D. 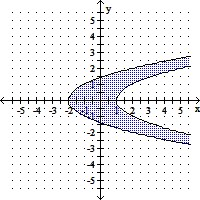
Answer: A
You might also like to view...
Outliers pose a problem for which type of average: mean or mode? Explain why. ?
A. ?The mode; An outlier will shift the mode to a different value. B. The mode; An outlier will decrease the frequency of the already existing mode. C. The mean; An outlier will increase the sum of the data values, thus increasing the mean. D. ?The mean; An outlier will decrease the sum of the data values, thus increasing the mean. E. ?Neither; Outliers do not significantly affect either average.
Solve.The following graph shows the number of male and female athletes at a university over a four-year period. 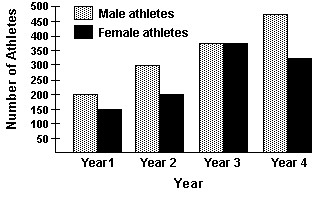 Which year had the smallest number of male athletes? What was the total number of male athletes that year?
A. Year 1; 150 athletes B. Year 4; 475 athletes C. Year 1; 200 athletes D. Year 2; 300 athletes
Provide an appropriate response.Plot the following point: (2, -1). Describe the process.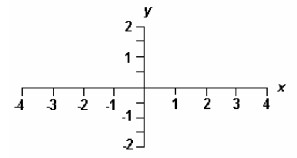
What will be an ideal response?
Encode or decode the given message, as requested, numbering the letters of the alphabet 1 through 26 in their usual order.Use the coding matrix A =  and its inverse A-1 =
  to decode the cryptogram
  .
.
A. ABLE B. ARMS C. ACTS D. ALAS