Refer to the information provided in Figure 20.1 below to answer the question(s) that follow.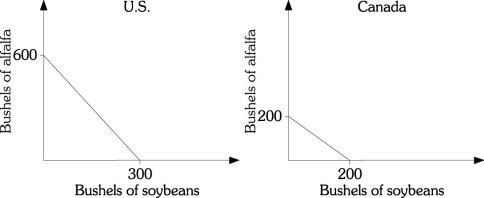 Figure 20.1Refer to Figure 20.1. The opportunity cost of producing a bushel of alfalfa in the United States is
A. half a bushel of soybeans.
B. 1 bushel of soybeans.
C. 2 bushels of soybeans.
D. 300 bushels of soybeans.
Answer: A
You might also like to view...
Suppose you are very picky about your outdoor BBQ experiences --- and you need exactly 1 cup of lighter fluid for each bag of charcoal you use. If you have either leftover charcoal or leftover lighter fluid, you simply discard it. a. With cups of lighter fluid on the horizontal and bags of charcoal on the vertical axis, illustrate some of your indifference curves. b. Suppose that your favorite charcoal has just gotten better because the producer has infused the charcoal with half a cup of lighter fluid per bag. How does your answer to (a) change? c. How could you change the units in which lighter fluid is measured on the horizontal axis to get your graph from (b) to look the same as you original graph in (a)?
What will be an ideal response?
________ is defined as any attempt to capture consumer surplus, producer surplus or economic profit
A) Search B) Rent seeking C) Maximizing monopoly profits D) Price discrimination
________ raised average tariff rates by over 50 percent in the United States in 1930
A) NAFTA B) The WTO C) The GATT D) The Smoot-Hawley Tariff
Figure 8-2
 Figure 8-2 shows a manufacturer’s total profit curve. To maximize total profit, the manufacturer should produce ____ units of output.
A. 10 B. 12 C. 16 D. 18