 Figure 3.6 illustrates a set of supply and demand curves for hamburgers. An increase in supply and an increase in demand are represented by a movement from:
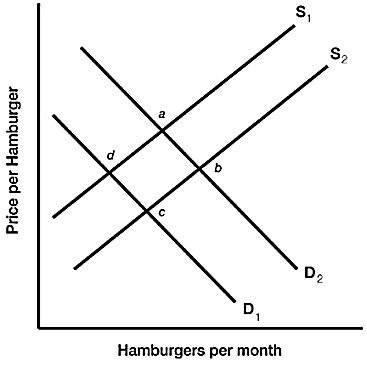
A. point d to point b.
B. point d to point a.
C. point c to point a.
D. point b to point c.
Answer: A
You might also like to view...
A cost-benefit calculation that focuses on the difference between a feasible alternative and the next feasible alternative is called:
A) marginal analysis. B) market analysis. C) Pareto analysis. D) behavioral analysis.
You are given the following market data for Venus automobiles in Saturnia
Demand: P = 35,000 - 0.5Q Supply: P = 8,000 + 0.25Q where P = Price and Q = Quantity. a. Calculate the equilibrium price and quantity. b. Calculate the consumer surplus in this market. c. Calculate the producer surplus in this market.
Refer to the information for this hypothetical economy provided in Table 20.1 below to answer the question(s) that follow.Table 20.1 2014 2015 2016QuarterIIIIIIIVIIIIIIIVIIIIIIIVOutput9094981029691888487949087Refer to Table 20.1. In this economy, a trough existed around the
A. fourth quarter of the year 2015 B. fourth quarter of the year 2014. C. third quarter of the year 2016. D. second quarter of the year 2015.
The idea of the "Invisible Hand" is that people make lifetime consumption plans.
Answer the following statement true (T) or false (F)