Figure 10-9
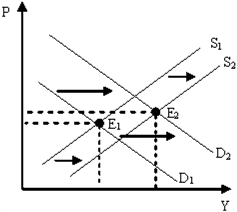
Figure 10-9 describes which of the following periods in the U.S.?
a.
1930s
b.
1973-1975
c.
late 1990s
d.
2007-2009
c
You might also like to view...
A lump-sum tax, such as a $1000 tax that every family must pay one time, is
A) negatively related to real GDP. B) an autonomous tax. C) a regressive tax. D) a type of income tax.
A price ceiling in the market for fuel oil that is below the equilibrium price will
A) lead to the quantity supplied of fuel oil exceeding the quantity demanded. B) lead to the quantity demanded of fuel oil exceeding the quantity supplied. C) decrease the demand for fuel oil. D) increase the supply of fuel oil. E) have no effect in the market for fuel oil.
The factor accounting for most of the earnings difference between equally educated and experienced men and women is that women
A. receive less pay for equal work. B. are segregated into low-paying occupations. C. receive comparable pay only when they do work of comparable value to the employer. D. are prohibited by law from doing certain kinds of work.
"Underground" economic activity can best be described as
a. the construction of subway transportation. b. the building of foundation structures for skyscrapers. c. the mining and oil industries. d. barter or cash activity that is not reported as income.