For a given seller, the figure below shows the relationship between the number of units produced and the opportunity cost of producing an additional unit of output. If the market price of this good is $6, how many units would this seller produce? 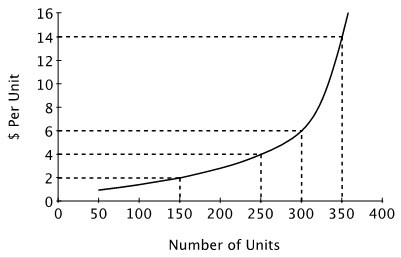
A. 250
B. 50
C. 150
D. 300
Answer: D
You might also like to view...
Use the following graph to answer the next question: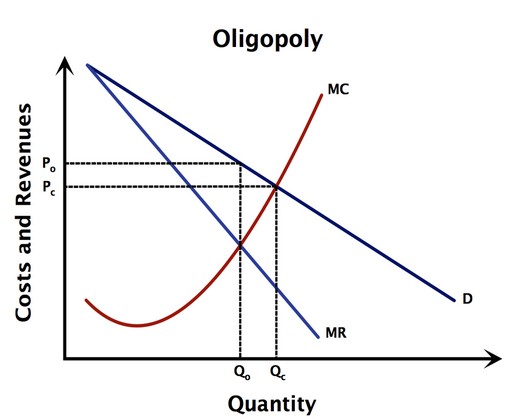 If the firm was operating as a perfectly competitive firm, what level of output would they produce to maximize profits?
A. Somewhere greater than Qc B. Qc C. Qo D. Somewhere between Qc and Qo
One basic way to boost the nation's growth rate is to
a. increase wages paid to labor. b. slow the rate of technical progress. c. reduce the population growth rate. d. accumulate more capital
The aggregate-demand curve shows that an increase in the price level
a) decreases the real value of goods and services demanded in the economy. b) decreases the dollar value of goods and services demanded in the economy. c) increases the real value of goods and services demanded in the economy. d) increases the dollar value of goods and services demanded in the economy.
The tax rate structure is the
A. measure of who pays the tax. B. study of how taxes change over time. C. percentage of a tax base that must be paid in taxes. D. measure or value upon which a tax is levied.