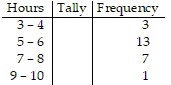
Use the data to make a frequency distribution table.Kevin asked some of his friends how many hours they worked during the previous week at their after-school jobs.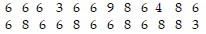 Frequency Distribution Table
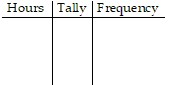
What will be an ideal response?
Frequency Distribution Table
You might also like to view...
Solve the problem.In the formula N = Iekt, N is the number of items in terms of an initial population I at a given time t and k is a growth constant equal to the percent of growth per unit time. There are currently 54 million cars in a certain country, increasing by 3.3% annually. How many years will it take for this country to have 82 million cars? Round to the nearest year.
A. 13 yr B. 8 yr C. 101 yr D. 4 yr
Name the conic (horizontal ellipse, vertical hyperbola, and so on) corresponding to the given equation.x2 - 49y2 = 49
A. Horizontal ellipse B. Vertical hyperbola C. Horizontal hyperbola D. Vertical ellipse
Find the indicated control limits.For a production process for which there is a great deal of data since its last modification, the population mean ? and the population standard deviation ? are assumed known. For such a process we have the following values for an R chart:central line = d2?, UCL = D2?, LCL = D1?(The values of d2, D1, and D2 are found in the table of control chart factors). In a bottling factory, after bottling, the volume of juice in seven sample bottles is checked every 30 minutes. For this process,  and
and  Find the central line, UCL, and
LCL for the range. A. 0.08, 0.160, 0.000 B. 0.216, 0.416, 0.016 C. 0.216, 0.154, 0.006 D. 0.203, 0.406, 0.000
Use estimation to determine which quotients is wrong.
A. 522,116 ÷ 28 = 22,647 B. 852,348 ÷ 21 = 40,588 C. 11,555,610 ÷ 66 = 175,085 D. 5,242,482 ÷ 207 = 25,326