Figure 18-1
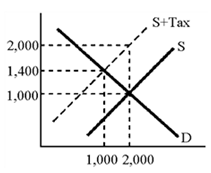
According to the graph in Figure 17-1, tax collections will be which of the following?
A. 14 million
B. 1.4 million
C. 12 million
D. 1 million
Answer: D
Economics
You might also like to view...
Refer to Figure 11.5. An increase in the level of investment is best illustrated by diagram
A) A. B) B. C) C. D) D.
Economics
Lump sum grants are sometimes referred to as categorical grants.
A. True B. False C. Uncertain
Economics
A bank provides:
A. liquidity; that is, access to cash when and where you want it. B. liquidity; that is, it connects buyers to sellers to ease saving and borrowing. C. risk diversification; that is, access to cash when and where you want it. D. risk diversification; that is, connecting buyers and sellers to ease saving and borrowing.
Economics
When bond prices fall, interest rates rise.
Answer the following statement true (T) or false (F)
Economics