Refer to the following graph. A decrease in demand is reflected as
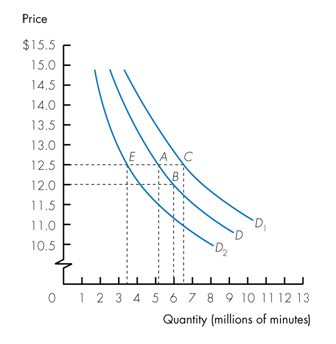
a. a shift of the demand curve from D to D1.
b. a shift of the demand curve from D to D2.
c. movement from point B to A along demand curve D.
d. movement from point A to C when the price is $12.50.
b. a shift of the demand curve from D to D2.
You might also like to view...
In general, it is common for goods with ________ to be auctioned
A) low prices B) relatively few buyers C) a large number of buyers D) a large number of sellers
In game theory, strategies include ________
A) all possible actions of each player B) only the winning action of each player C) all possible actions and payoffs of each player D) the payoff matrix
Van, whose utility of wealth curve is shown in the above figure, owns a home that is valued at $100,000. Initially there is a 10 percent chance that the house will be destroyed by hurricane
As the risk of destruction due to hurricane rises from 10 percent to 20 percent, the minimum cost of insurance A) stays the same. B) increases by $10,000. C) increases by $20,000. D) increases by $30,000.
Refer to the graphs below. Pizza and beer are the only two goods Jon consumes. The price of beer is $2.00 per pitcher and pizza is $1.25 per slice. If Jon has only $10 to spend for the evening, which graph represents the set of possible combinations of beer and pizza that he can buy?
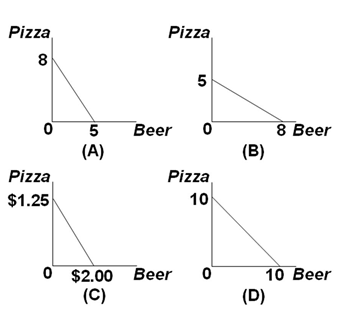
A. Graph A
B. Graph B
C. Graph C
D. Graph D