Using two carefully-labeled diagrams, explain how MPL and APL can be derived from a firm's production function. In your answer, explain the relationship between average and marginal product.
What will be an ideal response?
The firm's production function is illustrated in the left-hand panel of Figure 7.10. The APL at any level of labor (L) is measured as the slope of a line from the origin to the production function at L. The MPL at any level of labor (L) is measured as the slope of a line tangent to the production function at L. The relationship between average and marginal product of labor can be seen by comparing the slopes of these lines at different levels of labor.
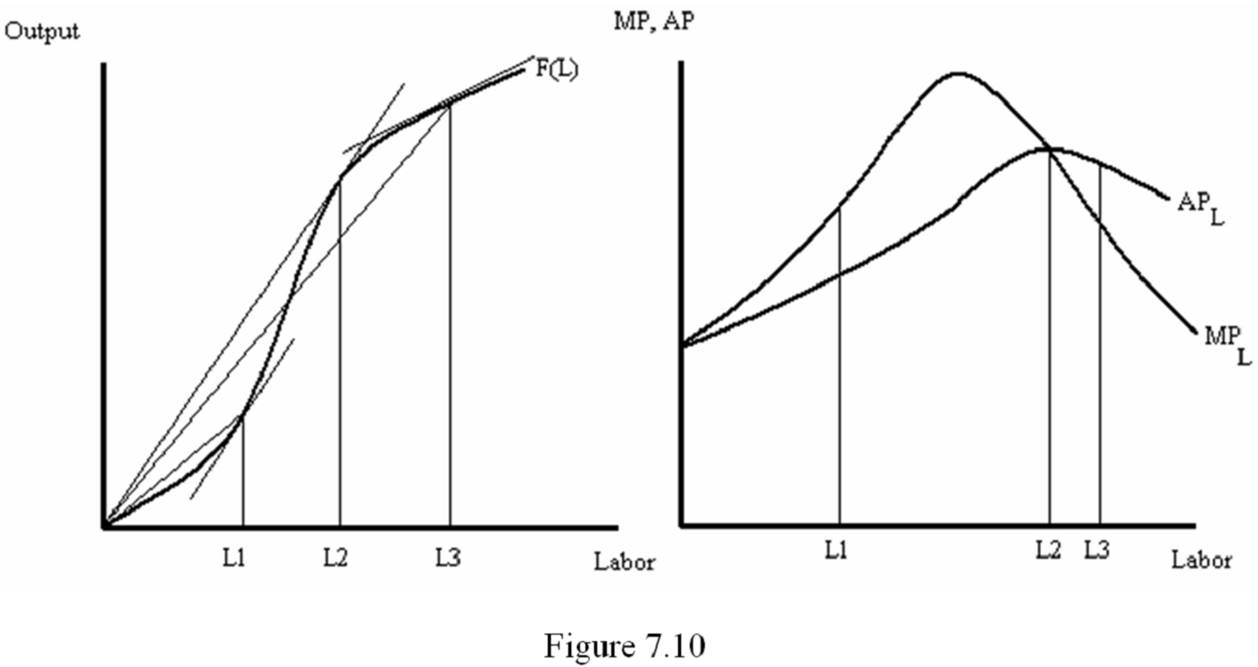
Consider the amount of labor represented by L1. At L1, the slope of the line tangent to the production function is greater than the slope of the line from the origin to the production function. This means that the MPL exceeds APL at L1. This is shown in the right-hand panel of Figure 7.10 where the MPL curve lies above the APL curve at L1 units of labor. At L2 units of labor, the slope of the line tangent to the production function is equal to the slope of the line from the origin to the production function. This means that the MPL is equal to APL at L2. This is shown in the right-hand panel of Figure 7.10 where the MPL curve intersects the APL curve at L2 units of labor. Finally, at L3 units of labor, the slope of the line tangent to the production function is less than the slope of the line from the origin to the production function. This means that the MPL is less than APL at L3. This is shown in the right-hand panel of Figure 7.10 where the MPL curve lies below the APL curve at L3 units of labor. These two graphs illustrate the basic relationship between the average product of labor and the marginal product of labor. Whenever MPL exceeds the APL, additional workers are more productive than the average. As a result, employing additional workers will cause APL to increase. Conversely, whenever MPL is less than APL, additional workers are less productive than average. As a result, hiring additional workers will cause APL to fall.
You might also like to view...
A shift of the demand curve to the left represents
A) an increase in demand. B) a decrease in demand. C) an increase in quantity demanded. D) a decrease in quantity demanded.
Assume that a one-year Malaysian bond yields 10 percent interest and that the dollar return on maturity is 5 percent. If the exchange rate at maturity is $1 = MYR 4.00 (Malaysian ringgit), what was the exchange rate at the time the bond was purchased?
a. $1 = MYR 4.2 b. $1 = MYR 3.8 c. $1 = MYR 3.6 d. MYR 1 = $0.26 e. MYR 1 = $0.4
Because increases in inflation reduce planned spending and short-run equilibrium output:
A. the short-run aggregate supply line is downward sloping. B. the aggregate demand curve is horizontal. C. the aggregate demand curve is upward sloping. D. the aggregate demand curve is downward sloping.
A firm sells a product in a purely competitive market. The marginal cost of the product at the current output of 1000 units is $2.50. The minimum possible average variable cost is $2.00. The market price of the product is $2.50. To maximize profit or minimize losses, the firm should:
A. shut down. B. produce more than 1000 units. C. continue producing 1000 units. D. produce less than 1000 units.