Refer to the figure below.________ inflation will eventually move the economy pictured in the diagram from short-run equilibrium at point ________ to long-run equilibrium at point ________, 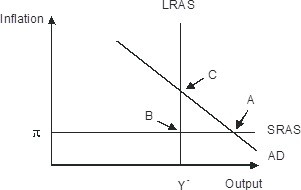
A. Rising; B; C
B. Falling; A; C
C. Falling; A; B
D. Rising; A; C
Answer: D
You might also like to view...
An increase in the supply (curve) of a good implies a larger quantity of the good will now be supplied
A) at the same price. B) even if the price falls substantially. C) only if the price rises. D) whenever the demand decreases.
The lifetime income distribution of income is a ________ accurate indicator of the degree of economic inequality than the distribution of ________
A) less; of annual income B) more; of annual income C) less; of wealth D) less; annual Lorenz curves
Refer to Figure 10-2. Which of the following statements is true?
A) Points a and b may not necessarily be the utility-maximizing quantities of ice cream cones at two different prices because we have no information on the consumer's budget or the price of other goods. B) Points a and b are derived independently of the utility-maximizing model. C) Points a and b are the utility-maximizing quantities of ice cream cones at two different prices of ice cream. D) Point a could be a utility-maximizing choice if the price is $3 but point b may not be because we have no information on the marginal utility per dollar when price changes.
What would happen in the market for rental housing in your community if the local government legally mandated rents that were below the market clearing price?
A) There would be a surplus of rental housing. B) There would be a shortage of rental housing. C) The demand for rental housing would increase. D) The supply of rental housing would decrease.