The figure below shows a situation where the producers of Good X are forming an international cartel. Here, MR = Marginal Revenue, and MC = Marginal Cost. The cartel will set a monopoly price for its output.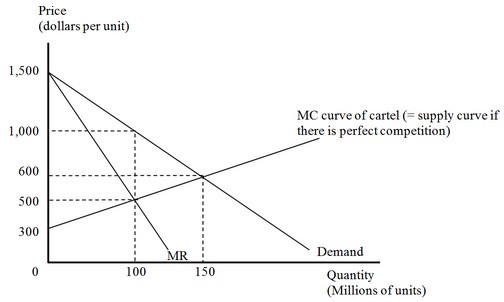 How much well-being would the world lose as a result of the formation of the cartel?
A. $15.0 billion
B. $12.5 billion
C. $50.0 billion
D. $5.0 billion
Answer: B
You might also like to view...
Use the following graphs for a perfectly competitive market in the short run to answer the next question.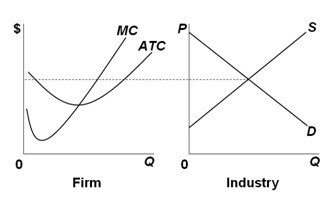 The graphs suggest that in the long run, assuming no changes in the given information,
A. buyers will leave the industry. B. more buyers will come to the market. C. some firms will exit from this industry. D. new firms will enter the industry.
The following data give the dates of successive turning points in U.S. economic activity and the corresponding levels of real GDP at the time.Turning PointDateReal GDP (1996 $ billions)(A)July 19531992.2(B)May 19541941.0(C)Apr. 19572182.7(D)Apr. 19582117.4(E)Apr. 19602391.0 The economy experienced a recession that lasted from:
A. May 1954 to April 1957. B. May 1954 to April 1958. C. July 1953 to April 1957. D. July 1953 to May 1954.
The difference between economic profit and accounting profit is equal to:
A. implicit and explicit costs. B. implicit and explicit revenues. C. zero. D. implicit revenues minus implicit costs.
The price elasticity of demand for business travel tends to be greater than that of leisure travel.
Answer the following statement true (T) or false (F)