Describe three arguments of why some economists object to the predictions of the rational expectations theory and do not subscribe to the conclusions of this approach
First, long-term contracts may be based on the best information at the time they are negotiated, but may not match current conditions. Oil prices fell dramatically in the mid-1990s and made contracts negotiated earlier when oil prices were much higher have unforeseen consequences for the parties to such contracts. Many oil firms who made plans and hired resources on the basis of expected high prices found their profits greatly reduced or, even worse, faced bankruptcy and unemployment. Second, expectations may be based on current conditions as well as future conditions. The inflation of the early 1980s was above 10 percent annually but fell rapidly by the mid-1980s. Contracts made at the earlier higher rates would have very different consequences than would have occurred had the inflation rates maintained their previous high levels. Third, the predictions of the rational expectations model have not matched the facts. Changes in unemployment away from the natural level have not been purely random. Anti-inflation programs have not been painless and short-lived. The anti-inflation policies of the early 1980s generated considerable unemployment that lasted for several years.
You might also like to view...
Since the Civil War, the poorest section of the country has been the __________.
Fill in the blank(s) with the appropriate word(s).
In the market for reserves, if the federal funds rate is between the discount rate and the interest rate paid on excess reserves, a ________ in the reserve requirement decreases the demand for reserves, ________ the federal funds interest rate,
everything else held constant. A) rise; lowering B) decline; raising C) decline; lowering D) rise; raising
A demand curve that shows the relationship between the price of a good and the amount of the good consumed holding the consumer's income fixed and allowing their well-being to vary is called:
A. an uncompensated demand curve. B. a compensated demand curve. C. a Hicksian demand curve. D. a derived demand curve.
Exhibit 5-8 Supply and demand curves for good X
?
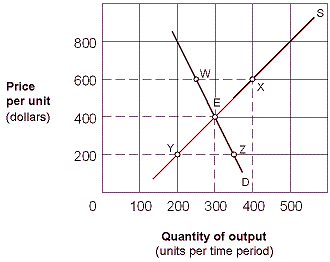 In Exhibit 5-8, the price elasticity of supply for good X between points E and X is:
A. 7/5 = 1.40. B. 1/5 = 0.20. C. 5/7 = 0.71. D. 1.