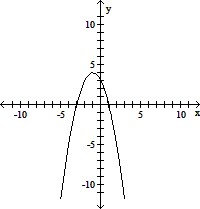
Use transformations to graph the function.y = 5 sin x - 1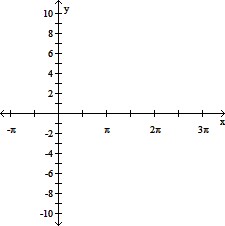
A. 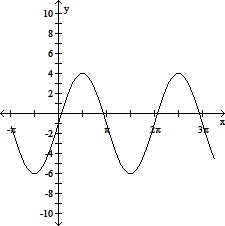
B. 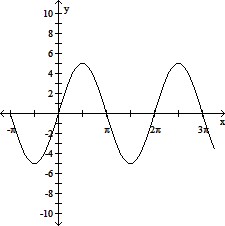
C. 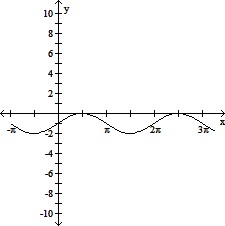
D. 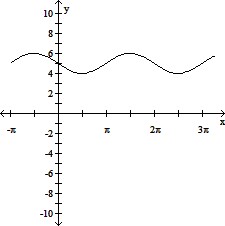
Answer: A
You might also like to view...
Solve the problem.The average price for a box of crackers from 2000 to 2010 can be approximated by 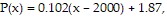 where x is the year. Evaluate P(2008) and round to the nearest hundredth. Interpret the result.
A. P(2008) = 2.69; the average price of a box of crackers in 2008 was $2.69. B. P(2008) = 2.69; the average price of a box of crackers in 2008 was $2.69 more than in 2000. C. P(2008) = 1.95; the average price of a box of crackers in 2008 was $1.95. D. P(2008) = 2.78; the average price of a box of crackers in 2008 was $2.78.
Find the length s. Round the answer to three decimal places.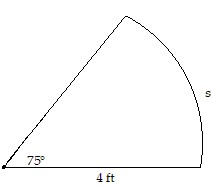
A. 5.76 ft B. 4.189 ft C. 5.236 ft D. 4.712 ft
Simplify the expression by performing the indicated operations. ?
?  - 4
- 4
A. 6 - 20
B. 9 - 20
C. -17
D. -2
Graph the function f by starting with the graph of y = x2 and using transformations (shifting, compressing, stretching, and/or reflection).f(x) = x2 + 2x - 3 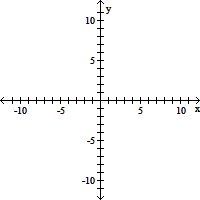
A. 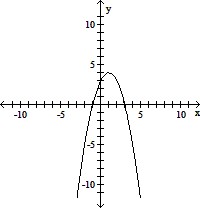
B. 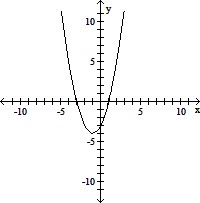
C. 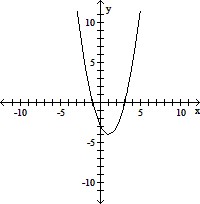
D.